Below is an example of Stiddle screenshots for a Lead Generation & B2B use case. To view screenshots of an e-commerce use case, please click here.

Dashboards
Skip right to dashboards.
Attribution
Skip right to attribution.
Audiences
Skip right to audiences.
People Profiles
Skip right to profiles.
Deal Profiles
Skip right to deals.
Company Profiles
Skip right to company.
Audiences
Skip right to audiences.
Reporting
Skip right to reporting.

Dashboards
Dashboards provide a flexible way to view and analyze multiple types of reporting data in one place. This can include ad platform insights, attribution insights, product performance, customer event data, custom conversion goals, and sales data.
 In the dashboard below, we’ll walk through several key sections. Dashboards are composed of sections and widgets. Sections help organize related data, while widgets display the specific metrics and visualizations you choose. Each widget is highly customizable, allowing you to adjust its size, colors, chart type, and underlying data.
 To add new data, drag a widget from the toolbar onto the dashboard canvas. Widgets can also be expanded to view the metric in a larger format for easier analysis.
 As we scroll further down in this dashboard example, you’ll notice additional sections. The next section displays performance insights from Google Ads. This data is pulled in near real time directly from Google and has not yet been attributed by Stiddle.
This view is useful for understanding high-level performance metrics such as impressions, clicks, and other non-conversion metrics. It’s also helpful for comparing native platform data with the attribution insights collected by Stiddle.
As we scroll further down in this dashboard example, you’ll notice additional sections. The next section displays performance insights from Google Ads. This data is pulled in near real time directly from Google and has not yet been attributed by Stiddle.
This view is useful for understanding high-level performance metrics such as impressions, clicks, and other non-conversion metrics. It’s also helpful for comparing native platform data with the attribution insights collected by Stiddle.
 In this section, we’re reviewing key conversion KPIs. In this example, we’ve got a few conversion goals configured in Stiddle, including form submissions, CRM pipeline stages, purchase, and phone calls. Conversion goals are used in Stiddle for tracking an outcome, for example - a purchase, signup, phone call, CRM pipeline stage, or booked demo. Conversion goals are very customizable within Stiddle and can be configured for different use cases and customer journeys.
In this example below, you’ll see data coming from a few sources, including Salesforce CRM. Stiddle integrates with all major CRM platforms (ie. Salesforce, HubSpot, etc.).
For custom platforms or more advanced CRM configurations, Stiddle also supports webhooks, allowing sales data and events to be sent in real time.
In this section, we’re reviewing key conversion KPIs. In this example, we’ve got a few conversion goals configured in Stiddle, including form submissions, CRM pipeline stages, purchase, and phone calls. Conversion goals are used in Stiddle for tracking an outcome, for example - a purchase, signup, phone call, CRM pipeline stage, or booked demo. Conversion goals are very customizable within Stiddle and can be configured for different use cases and customer journeys.
In this example below, you’ll see data coming from a few sources, including Salesforce CRM. Stiddle integrates with all major CRM platforms (ie. Salesforce, HubSpot, etc.).
For custom platforms or more advanced CRM configurations, Stiddle also supports webhooks, allowing sales data and events to be sent in real time.
 This next section is made up primarily of cost-related metrics, including both attributed and platform-reported data. For example, the Cost Per Closed Won metric displays a Stiddle icon alongside the Google icon. This indicates that the metric is attributed and calculated by Stiddle.
Metrics that do not display the Stiddle icon are reported directly by the ad platform.
Other common cost-related metrics include cost per demo booked, purchase, signup, phone call, and more. These metrics are typically calculated based on the previously defined conversion goals.
This next section is made up primarily of cost-related metrics, including both attributed and platform-reported data. For example, the Cost Per Closed Won metric displays a Stiddle icon alongside the Google icon. This indicates that the metric is attributed and calculated by Stiddle.
Metrics that do not display the Stiddle icon are reported directly by the ad platform.
Other common cost-related metrics include cost per demo booked, purchase, signup, phone call, and more. These metrics are typically calculated based on the previously defined conversion goals.
 In this section, we’re reviewing conversion metrics. In this example, these widgets primarily focus on conversion-related data and their revenue, filtered by channel.
In the example below, the widgets outlined in the red box represent Conversion Value (Revenue) metrics. The widget on the left displays only the Google icon and does not include the Stiddle icon. This indicates that it is a platform-reported metric and has not yet been tracked or attributed by Stiddle. In this case, Google Ads is reporting just over $53,000 in revenue.
However, this does not reflect the full conversion value. The widget on the right displays both the Stiddle and Google icons, indicating that the metric is attributed by Stiddle. As a result, the Conversion Value is significantly higher—just over $95,000—providing a more accurate representation of the revenue driven by Google Ads.
In this section, we’re reviewing conversion metrics. In this example, these widgets primarily focus on conversion-related data and their revenue, filtered by channel.
In the example below, the widgets outlined in the red box represent Conversion Value (Revenue) metrics. The widget on the left displays only the Google icon and does not include the Stiddle icon. This indicates that it is a platform-reported metric and has not yet been tracked or attributed by Stiddle. In this case, Google Ads is reporting just over $53,000 in revenue.
However, this does not reflect the full conversion value. The widget on the right displays both the Stiddle and Google icons, indicating that the metric is attributed by Stiddle. As a result, the Conversion Value is significantly higher—just over $95,000—providing a more accurate representation of the revenue driven by Google Ads.
 In the final section, you’ll see Stiddle Web metrics. This section displays website analytics tracked by Stiddle IRIS.
While these metrics are similar to what you might see in tools like GA4, Stiddle differs in how data is tracked and ingested. One of the key differences is that Stiddle automatically identifies and removes third-party bot and crawler traffic from all analytics and attribution data.
This provides a higher level of accuracy and a clearer view of real user behavior compared to traditional analytics platforms.
In the final section, you’ll see Stiddle Web metrics. This section displays website analytics tracked by Stiddle IRIS.
While these metrics are similar to what you might see in tools like GA4, Stiddle differs in how data is tracked and ingested. One of the key differences is that Stiddle automatically identifies and removes third-party bot and crawler traffic from all analytics and attribution data.
This provides a higher level of accuracy and a clearer view of real user behavior compared to traditional analytics platforms.

A few other features worth noting:
- Dashboards can be shared via a live, hosted link or exported as PDFs
- Dashboards can be white-labeled with your logo for a fully branded experience
While this doesn’t cover everything dashboards can do in Stiddle, it provides you an inside look at some of the basics! 
Attribution
Attribution is the foundation for making profitable and scalable GTM decisions. Within Stiddle, attribution insights can be viewed in several ways, including attribution tables, reports, dashboards, profiles, and even audiences. In this example, we’ll focus specifically on Attribution Tables.
In the Attribution Table below, we’re looking at two connected channels: Google Ads and Meta Ads. It’s important to note that Stiddle supports attribution across dozens of channels, including PPC platforms, paid social platforms, DSPs, ESPs, phone, email, SMS, and more—including organic traffic and LLM-driven sources (ie. ChatGPT, etc.).
 If we take a closer look at the table, you’ll notice several key differences compared to an ad platform’s native reporting interface. In some columns, you’ll see a Stiddle icon. Columns with this icon represent metrics that have been tracked and attributed by Stiddle, while columns without the icon are reported directly by the platform.
When comparing Google’s non-attributed ROAS metric to Stiddle’s attributed ROAS, the difference becomes clear. Google reports that for every dollar spent on Google Ads, it generated a return of $10.65. However, the Stiddle-attributed ROAS shows that Google is actually responsible for generating $15.65 for every dollar spent.
That’s a $5 increase in return per dollar, representing a significant amount of revenue that is not captured or reported in Google’s native platform reporting.
If we take a closer look at the table, you’ll notice several key differences compared to an ad platform’s native reporting interface. In some columns, you’ll see a Stiddle icon. Columns with this icon represent metrics that have been tracked and attributed by Stiddle, while columns without the icon are reported directly by the platform.
When comparing Google’s non-attributed ROAS metric to Stiddle’s attributed ROAS, the difference becomes clear. Google reports that for every dollar spent on Google Ads, it generated a return of $10.65. However, the Stiddle-attributed ROAS shows that Google is actually responsible for generating $15.65 for every dollar spent.
That’s a $5 increase in return per dollar, representing a significant amount of revenue that is not captured or reported in Google’s native platform reporting.
 It’s important to note that Stiddle does not always report higher conversion values than the platform. In some cases, the opposite is true. For example, when looking at the Meta (Facebook) Ads channel, Stiddle reports a lower return than the platform.
For every dollar spent on Facebook Ads, Stiddle attributes $1.83 in return, compared to the platform-reported $1.69. Regardless of whether the attributed value is higher or lower than the platform’s numbers, Stiddle’s goal is to report what actually happened with the highest level of accuracy and transparency.
It’s important to note that Stiddle does not always report higher conversion values than the platform. In some cases, the opposite is true. For example, when looking at the Meta (Facebook) Ads channel, Stiddle reports a lower return than the platform.
For every dollar spent on Facebook Ads, Stiddle attributes $1.83 in return, compared to the platform-reported $1.69. Regardless of whether the attributed value is higher or lower than the platform’s numbers, Stiddle’s goal is to report what actually happened with the highest level of accuracy and transparency.

There are many reasons why data reported by native ad platforms can be inaccurate, but two primary factors stand out.
- First, most ad platforms do not communicate with one another—and they have little incentive to do so, as they are competing for the same ad spend. When running cross-channel campaigns, this creates a major attribution challenge. Each platform attempts to take credit for the same conversion, resulting in duplicated or inflated conversion reporting rather than a clear understanding of which channels actually drove the outcome.
- Second, most ad platforms rely on limited lookback windows, typically capped at 7 days when using native platform data. While some platforms offer extended windows such as 28 or 90 days, these longer windows often rely heavily on statistical modeling rather than true end-to-end tracking. As a result, not every touchpoint is captured accurately, and conversions are estimated rather than observed.
Stiddle solves both of these issues by unifying cross-channel data and attributing conversions based on what actually occurred—without duplication or opaque modeling.  You’ll now see a complete list of every individual person, companies, and deals/oppurtunities that Stiddle has attributed to Google Ads. This level of transparency goes far beyond what native ad platforms provide, where attribution data is often hidden in a black box.
Stiddle displays every individual person, company, and deal/oppurtunity, along with the associated lead’s name, email address, and the weighted distribution of attribution credit across touchpoints. To explore a specific customer journey in more detail, simply select the lead’s name or view the company or deal by selecting the appropriate tab. Stiddle will then open a full customer profile, showing all events and every touchpoint that contributed to the conversion.
You’ll now see a complete list of every individual person, companies, and deals/oppurtunities that Stiddle has attributed to Google Ads. This level of transparency goes far beyond what native ad platforms provide, where attribution data is often hidden in a black box.
Stiddle displays every individual person, company, and deal/oppurtunity, along with the associated lead’s name, email address, and the weighted distribution of attribution credit across touchpoints. To explore a specific customer journey in more detail, simply select the lead’s name or view the company or deal by selecting the appropriate tab. Stiddle will then open a full customer profile, showing all events and every touchpoint that contributed to the conversion.
 Let’s take a look at a lead’s profile for a user who interacted with a Google Ad and was attributed accordingly.
Within the profile, you’ll see a comprehensive view of the customer’s data. On the left-hand side, you’ll find core identity details such as name, email, and phone number. On the right, you’ll see a series of widgets. In this example, Salesforce is connected, so the widgets display an overview of CRM pipline KPIs. Depending on your setup and use case, Stiddle can also surface data from other systems, such as e-commerce platforms or additional sales platforms.
Below this, you’ll find a traffic overview that includes session analytics, form submissions, and any custom conversion goals you’ve configured. In the lower-left section of the profile, you’ll also see location details and additional contextual information.
Let’s take a look at a lead’s profile for a user who interacted with a Google Ad and was attributed accordingly.
Within the profile, you’ll see a comprehensive view of the customer’s data. On the left-hand side, you’ll find core identity details such as name, email, and phone number. On the right, you’ll see a series of widgets. In this example, Salesforce is connected, so the widgets display an overview of CRM pipline KPIs. Depending on your setup and use case, Stiddle can also surface data from other systems, such as e-commerce platforms or additional sales platforms.
Below this, you’ll find a traffic overview that includes session analytics, form submissions, and any custom conversion goals you’ve configured. In the lower-left section of the profile, you’ll also see location details and additional contextual information.
 As you continue scrolling, you’ll see a complete timeline of events and touchpoints the customer interacted with before making a conversion. In this example, the customer engaged with several Meta (Facebook) ads as well as Klaviyo email campaigns.
Selecting the dropdown arrow expands each touchpoint to reveal additional details. For Facebook interactions, this includes the specific campaign, ad set, and ad. While this level of granularity is valuable, it can be difficult to make decisions at an individual profile level alone. To explore this data more effectively, let’s click into one of the campaigns.
As you continue scrolling, you’ll see a complete timeline of events and touchpoints the customer interacted with before making a conversion. In this example, the customer engaged with several Meta (Facebook) ads as well as Klaviyo email campaigns.
Selecting the dropdown arrow expands each touchpoint to reveal additional details. For Facebook interactions, this includes the specific campaign, ad set, and ad. While this level of granularity is valuable, it can be difficult to make decisions at an individual profile level alone. To explore this data more effectively, let’s click into one of the campaigns.
 When you click on a campaign, ad set, or ad from the profile’s event timeline, Stiddle automatically navigates back to the attribution table and applies the appropriate filters. This allows you to instantly view performance data for that specific asset in context.
From here, you can see a complete list of campaigns, ad sets, or ads across every connected channel. For PPC channels, Stiddle also surfaces individual assets and keywords for deeper analysis.
When you click on a campaign, ad set, or ad from the profile’s event timeline, Stiddle automatically navigates back to the attribution table and applies the appropriate filters. This allows you to instantly view performance data for that specific asset in context.
From here, you can see a complete list of campaigns, ad sets, or ads across every connected channel. For PPC channels, Stiddle also surfaces individual assets and keywords for deeper analysis.
 Now that we’ve seen the event touchpoints Stiddle is capable of collecting, it’s important to understand how attribution credit is distributed across those touchpoints. As shown in the profile above, this customer interacted with multiple Facebook ads, Google ads, and email campaigns before completing a conversion goal (ie. form submission, purchase, CRM stage, booking, etc.).
To allocate credit across the full conversion journey, Stiddle uses attribution models. These models determine how credit is assigned to different channels and touchpoints involved in a conversion. Stiddle offers several attribution models out of the box to support different use cases, including standard models such as last click, first click, and linear.
However, Stiddle takes attribution modeling a step further in three key ways:
Now that we’ve seen the event touchpoints Stiddle is capable of collecting, it’s important to understand how attribution credit is distributed across those touchpoints. As shown in the profile above, this customer interacted with multiple Facebook ads, Google ads, and email campaigns before completing a conversion goal (ie. form submission, purchase, CRM stage, booking, etc.).
To allocate credit across the full conversion journey, Stiddle uses attribution models. These models determine how credit is assigned to different channels and touchpoints involved in a conversion. Stiddle offers several attribution models out of the box to support different use cases, including standard models such as last click, first click, and linear.
However, Stiddle takes attribution modeling a step further in three key ways:
- Stiddle creates custom AI models post-trained on the brands data
- Gives transparency and explaines how the model was created in plain english using LLMs
- Accounts for TOF view-though data to understand the impact on BOF conversions


A few other features worth noting:
- Stiddle isn’t only for tracking purchases, custom goals can be configured and used for similar insights in attribution. For example - tracking form submissions, phone calls, or bookings.
- Stiddle works with more than just Google & Meta (Facebook). Including - PPC platforms, paid social platforms, DSPs, ESPs, phone, email, SMS, and more—including organic traffic and LLM-driven sources (ie. ChatGPT, etc.).
While this doesn’t cover everything attribution can do in Stiddle, it provides you an inside look at some of the basics! 
People Profiles
Stiddle builds profiles for each person who interacts with your brand and creates an activity timeline of events. These profiles are powered by Stiddle IRIS technology, meaning they can be tracked for up to three years without the use of cookies. This is important because cookies are heavily restricted by most browsers—for example, about 60% of people on Google Chrome opt out of cookies (both first- and third-party). More importantly, even for the remaining 40% who accept cookies, most browsers reset them after seven days, so they do not persist long enough to capture the full customer journey.
Stiddle profiles create a single source of truth for every touchpoint, event, and conversion a person has with your brand. Profiles are flexible, allowing Stiddle to ingest and track customer data from many sources. For example, you can track any ad or marketing channel, phone calls, form submissions, sign-ups, calendar bookings, purchases, CRM deal stages, chatbots, and more.
First, Stiddle generates an anonymous profile for each unique individual who interacts with your brand. While Stiddle may not immediately know who the person is, it begins collecting data such as IP, location, and every touchpoint (for example, clicking a Facebook ad → viewing a website page → submitting a form → booking a demo → CRM stage closed won).
 As we scroll down the anonymous profile, we begin to see the different event touchpoints the person has made. We can see that this profile clicked on a Meta ad, then viewed a product page. Shortly after, another Meta ad was clicked.
 The moment an anonymous profile provides identifiable information—for example, by filling out a form on the website, making a purchase, signing up, or booking a demo—Stiddle merges the data and de-anonymizes the profile, classifying it as known.
Anonymous profiles do not need to provide identifiable information right away. Since Stiddle continuously tracks these profiles for up to three years, it will automatically identify the person when the time is right and merge all previous event and touchpoint history.
The moment an anonymous profile provides identifiable information—for example, by filling out a form on the website, making a purchase, signing up, or booking a demo—Stiddle merges the data and de-anonymizes the profile, classifying it as known.
Anonymous profiles do not need to provide identifiable information right away. Since Stiddle continuously tracks these profiles for up to three years, it will automatically identify the person when the time is right and merge all previous event and touchpoint history.
 Now that this profile has been identified, it is no longer anonymous. We can see a full breakdown of insights related to this person’s history with the brand.
As we scroll down, you’ll see more events added to the activity timeline. Stiddle’s goal is to capture every single touchpoint someone makes with the brand.
Filtering in Stiddle is very flexible for profiles. You can easily filter profiles—both anonymous and known—using hundreds of properties from event data, ad data, customer data, product data, and more.
Now that this profile has been identified, it is no longer anonymous. We can see a full breakdown of insights related to this person’s history with the brand.
As we scroll down, you’ll see more events added to the activity timeline. Stiddle’s goal is to capture every single touchpoint someone makes with the brand.
Filtering in Stiddle is very flexible for profiles. You can easily filter profiles—both anonymous and known—using hundreds of properties from event data, ad data, customer data, product data, and more.

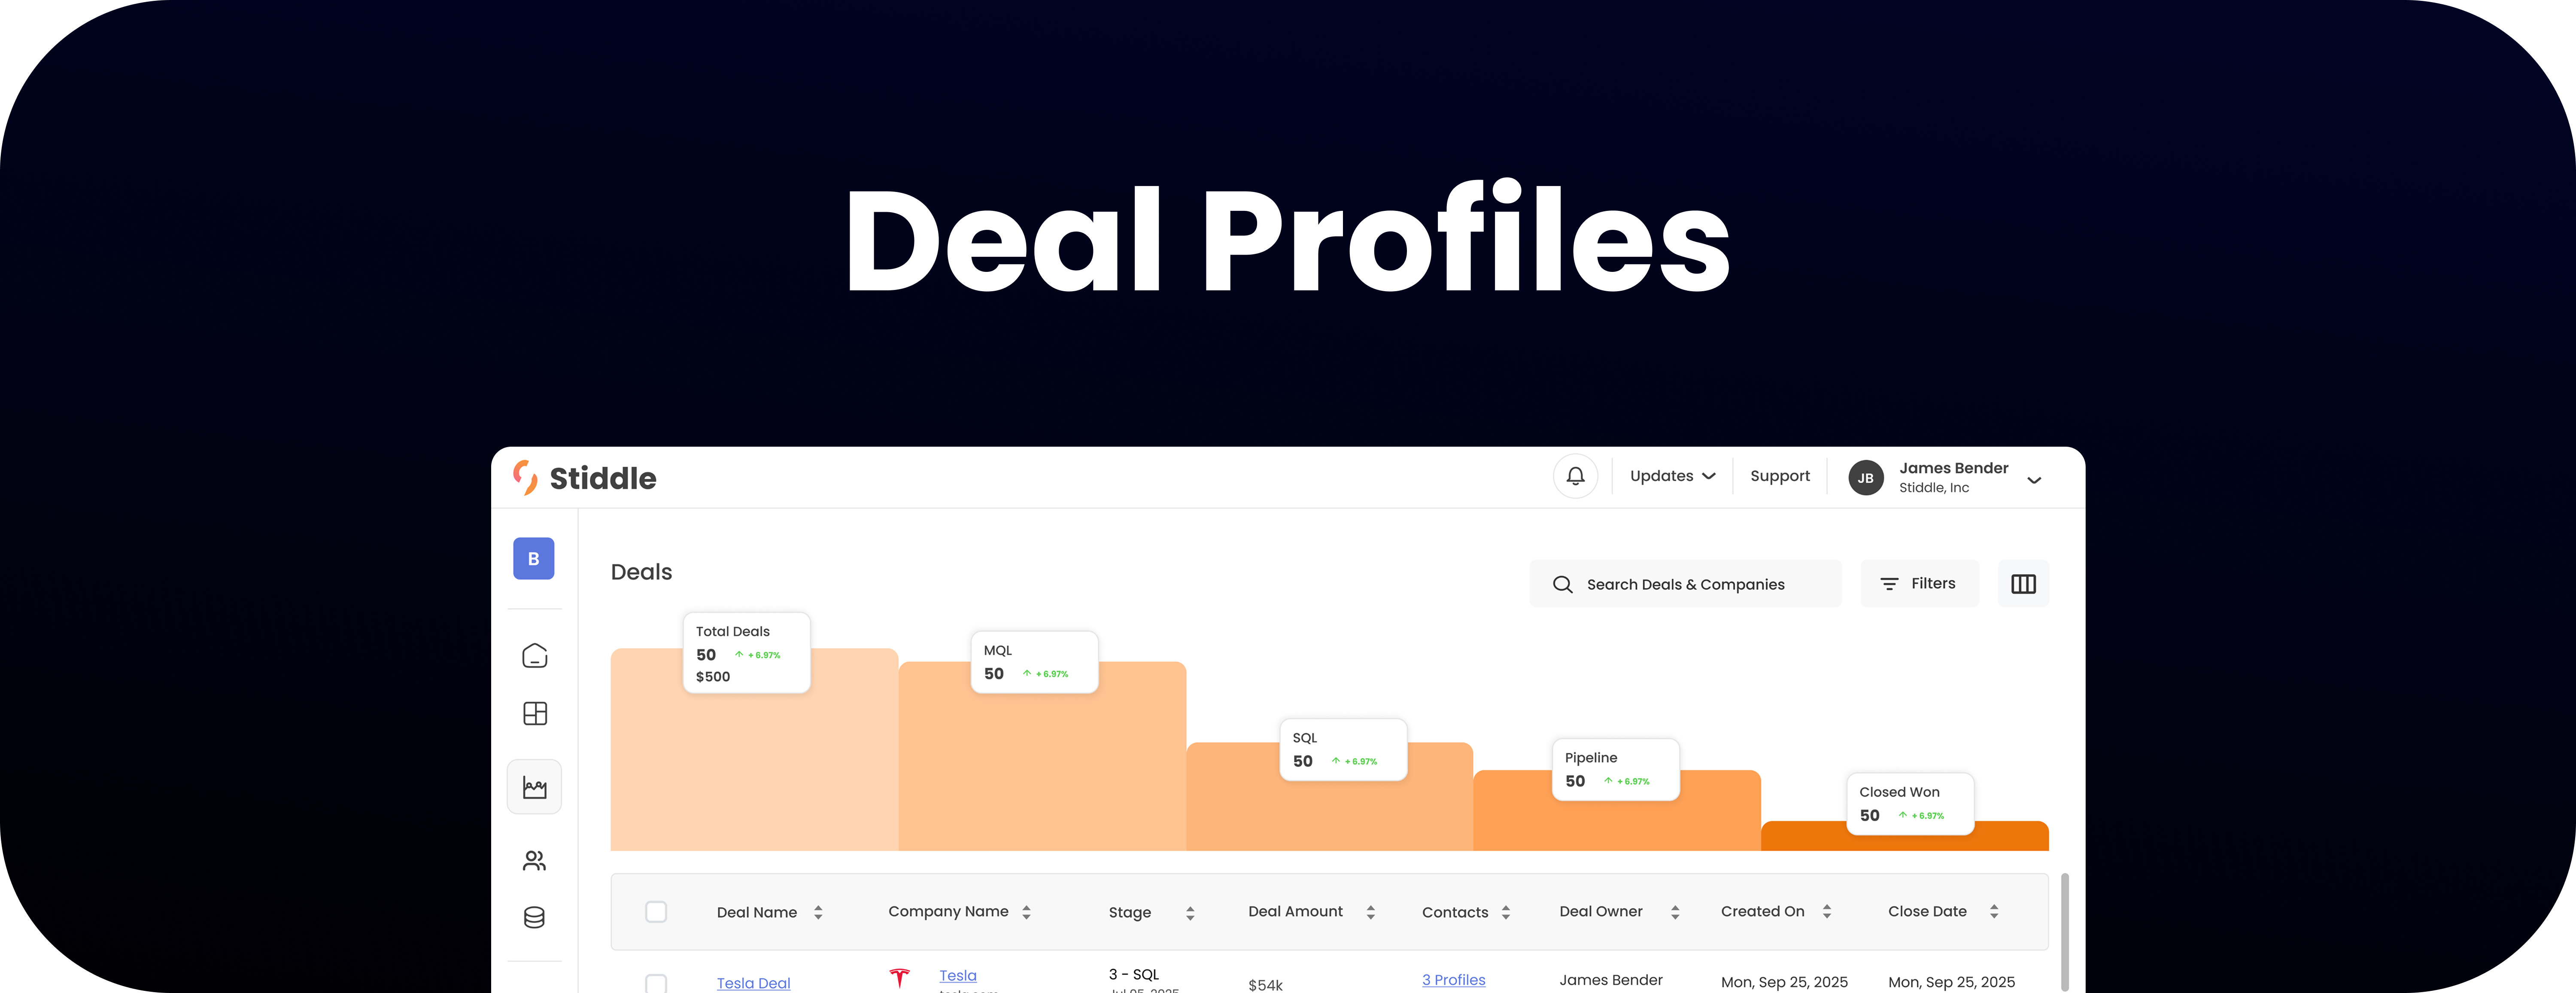 Deal profiles allow you to sync your CRM data from platforms like Salesforce and HubSpot to Stiddle. Stiddle will sync all of your historical customers, contacts, opportunities, and companies. You can think of opportunities and deals as the same thing.
With deal profiles, Stiddle gives you the ability to attribute not only at the person or company level, but also at the deal level. This is very valuable for understanding the impact that a marketing team and individual channels have on generating leads that ultimately convert into sales through your CRM.
Deal profiles allow you to sync your CRM data from platforms like Salesforce and HubSpot to Stiddle. Stiddle will sync all of your historical customers, contacts, opportunities, and companies. You can think of opportunities and deals as the same thing.
With deal profiles, Stiddle gives you the ability to attribute not only at the person or company level, but also at the deal level. This is very valuable for understanding the impact that a marketing team and individual channels have on generating leads that ultimately convert into sales through your CRM.
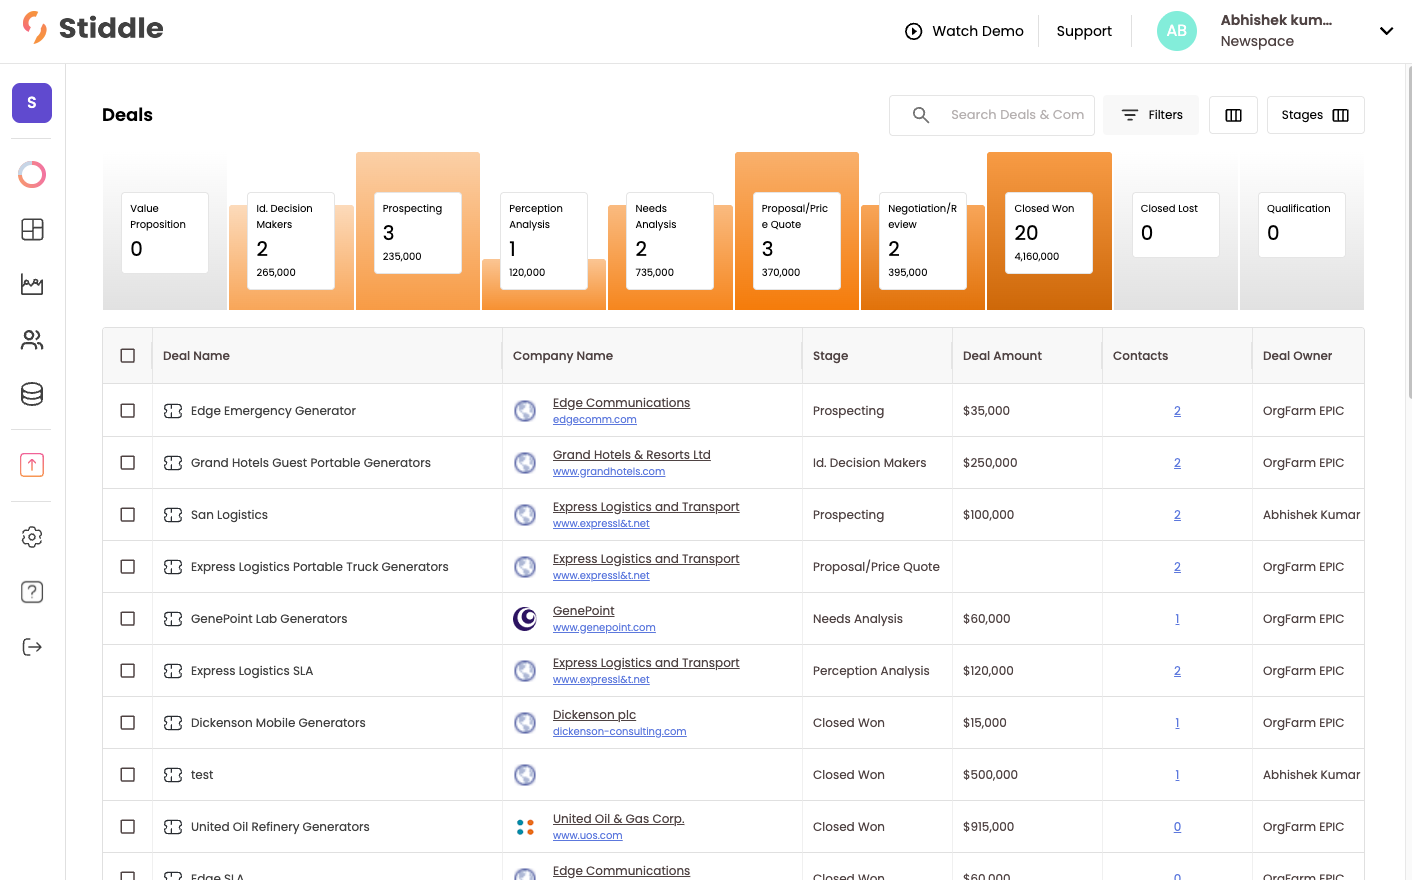 There are several ways to view deal data in Stiddle. Let’s take a look at the attribution table to understand conversions.
In real time, Stiddle syncs the conversion value and stage of each opportunity from your CRM and uses this data in attribution to calculate metrics such as profitability, revenue, conversion value, and cost per closed won deal. You also get very useful metrics like Open Opportunities, which shows how many deals are actively open in a stage other than Closed Won that originated from a specific channel. For example: Meta = 100 Open Opportunities, Google = 50 Open Opportunities.
There are several ways to view deal data in Stiddle. Let’s take a look at the attribution table to understand conversions.
In real time, Stiddle syncs the conversion value and stage of each opportunity from your CRM and uses this data in attribution to calculate metrics such as profitability, revenue, conversion value, and cost per closed won deal. You also get very useful metrics like Open Opportunities, which shows how many deals are actively open in a stage other than Closed Won that originated from a specific channel. For example: Meta = 100 Open Opportunities, Google = 50 Open Opportunities.
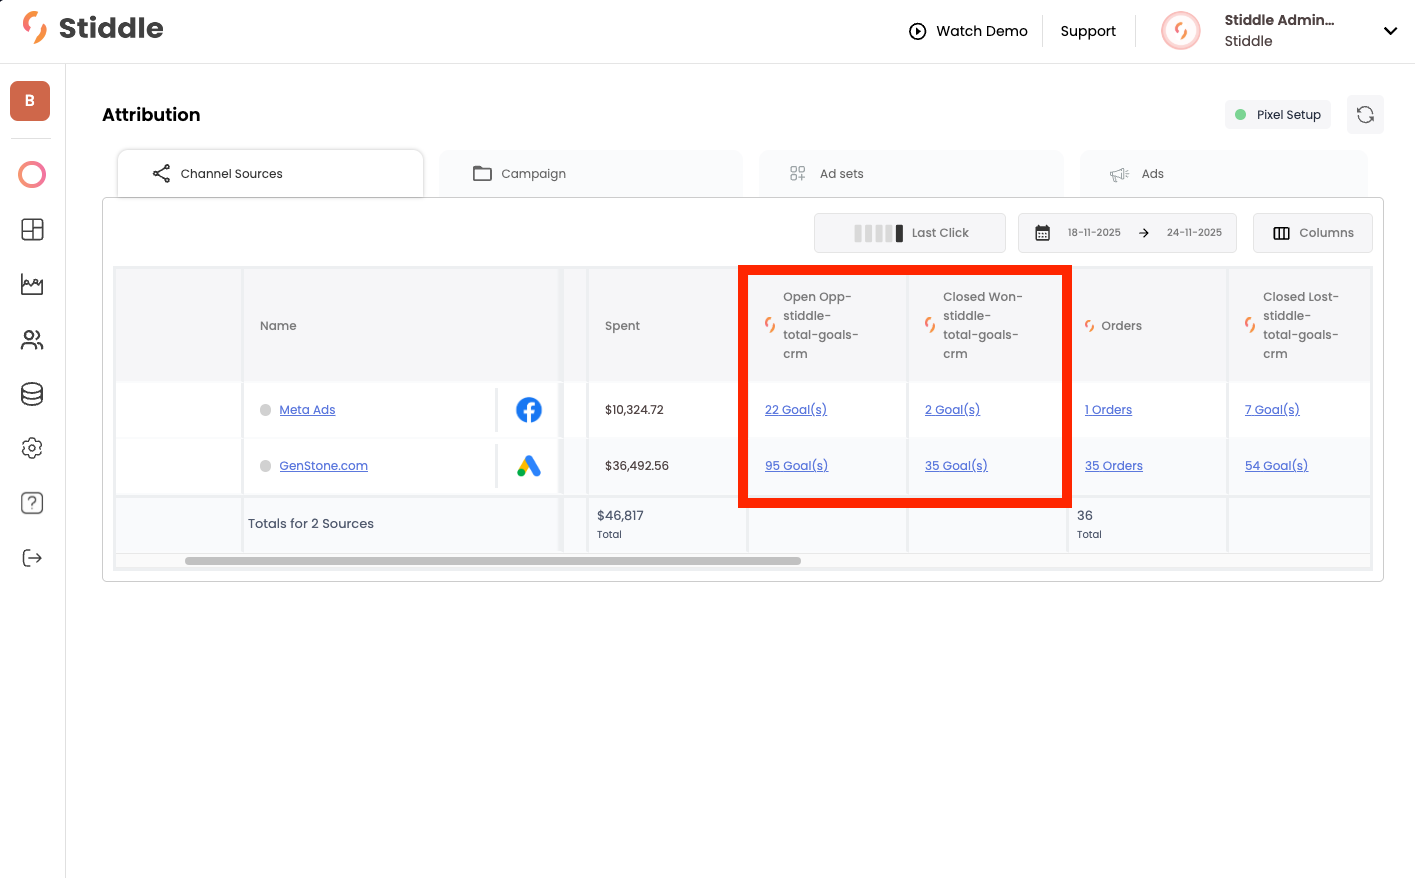 You can also track closed opportunities, such as Closed Won and Closed Lost. This allows Stiddle to show the revenue generated from a specific deal stage, broken down by channel or campaign.
In this example, you’ll see that Stiddle captured just under $42,000 in Closed Won opportunities that Google is responsible for generating, and just under $4,000 from Meta. Most importantly, you can also see the Open Opportunities column, which shows that both channels are promising in generating future conversions. In total, there is just under $150,000 in open pipeline generated by Google and Meta.
You can also track closed opportunities, such as Closed Won and Closed Lost. This allows Stiddle to show the revenue generated from a specific deal stage, broken down by channel or campaign.
In this example, you’ll see that Stiddle captured just under $42,000 in Closed Won opportunities that Google is responsible for generating, and just under $4,000 from Meta. Most importantly, you can also see the Open Opportunities column, which shows that both channels are promising in generating future conversions. In total, there is just under $150,000 in open pipeline generated by Google and Meta.
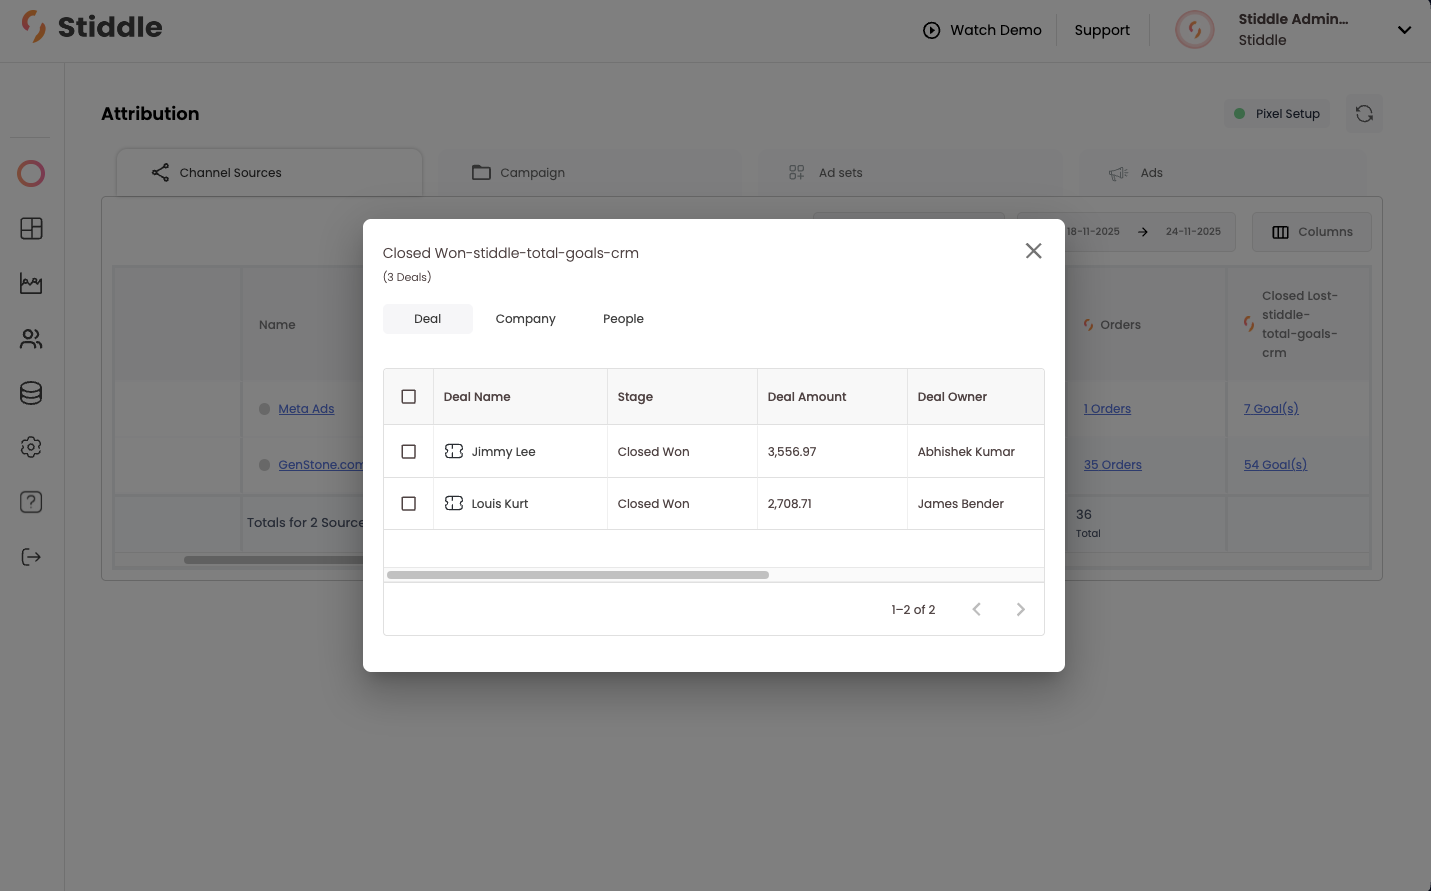
 At any time, you can easily select the number of conversions in the table to see which deals, companies, and people have been attributed to that channel. You can also understand which rep was responsible for closing the deal and which channel generated the lead. In the example below, Meta was responsible for generating the lead, and Abhishek was the sales rep who closed the deal. For a deeper dive into the customer’s journey, you can select their profile.
 Company profiles allow Stiddle to group people and deals related to a company. This data is often synced from a CRM, such as Salesforce or HubSpot. Once synced, Stiddle retroactively merges people profiles with any company or opportunity data from the CRM.
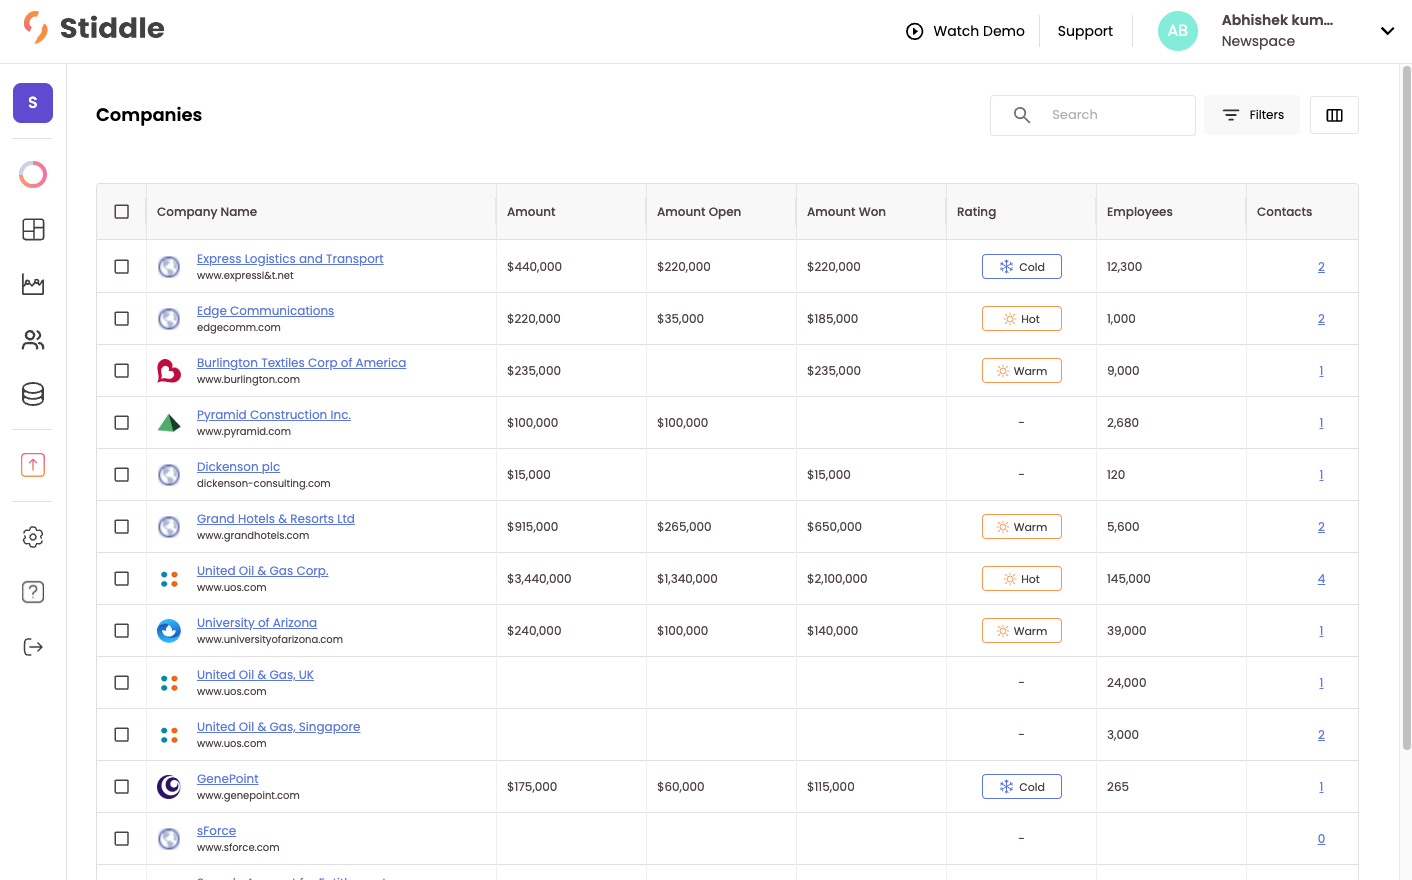
Let’s take a look at the Companies page. Below, you’ll see all companies listed in a table, along with metrics that Stiddle has calculated from deals.
Company profiles allow Stiddle to group people and deals related to a company. This data is often synced from a CRM, such as Salesforce or HubSpot. Once synced, Stiddle retroactively merges people profiles with any company or opportunity data from the CRM.
Let’s take a look at the Companies page. Below, you’ll see all companies listed in a table, along with metrics that Stiddle has calculated from deals.
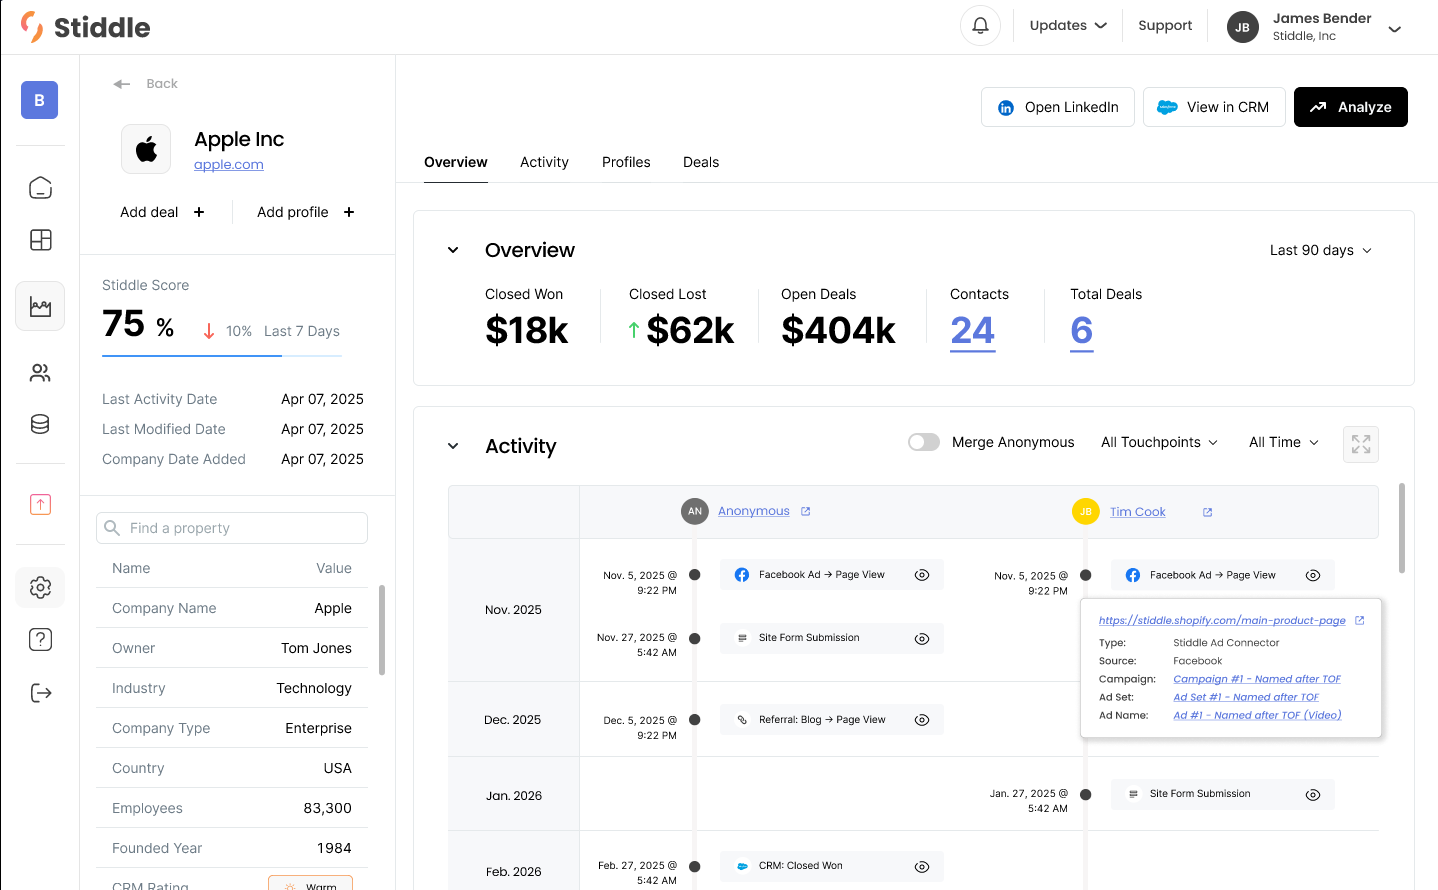
 Stiddle can use company profiles for attribution, allowing you to understand which channels are responsible for generating company leads. People Profiles are grouped within the company profile, meaning you can see all people associated with a company and their entire journey in one view.
For example, below you’ll see an overview of the company data on the left, attributed KPIs in the middle, and just below that, a timeline of activity for each person related to this company who has shown interest or has interacted with the company.
Stiddle can use company profiles for attribution, allowing you to understand which channels are responsible for generating company leads. People Profiles are grouped within the company profile, meaning you can see all people associated with a company and their entire journey in one view.
For example, below you’ll see an overview of the company data on the left, attributed KPIs in the middle, and just below that, a timeline of activity for each person related to this company who has shown interest or has interacted with the company.
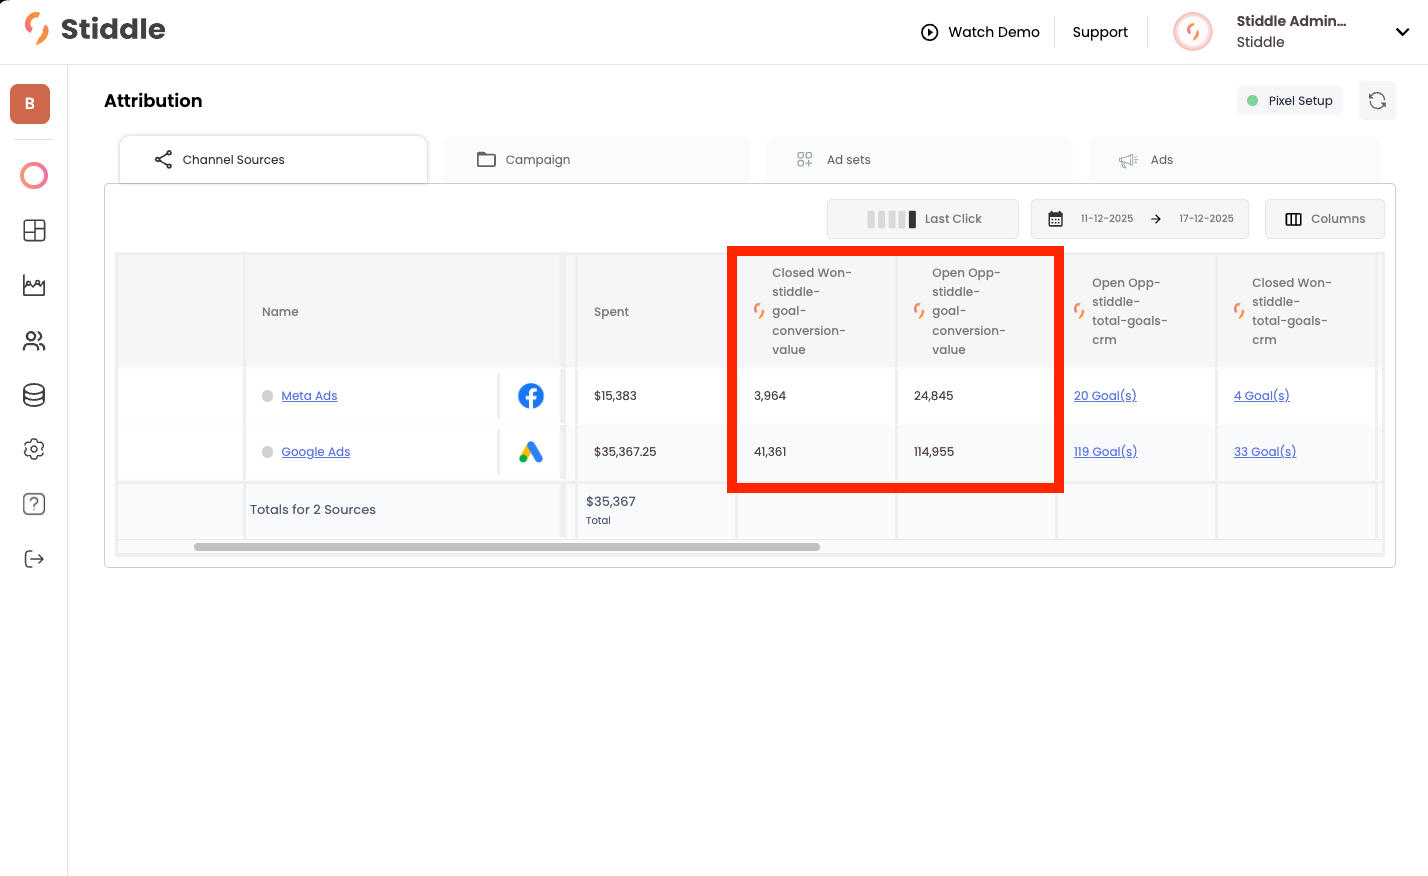
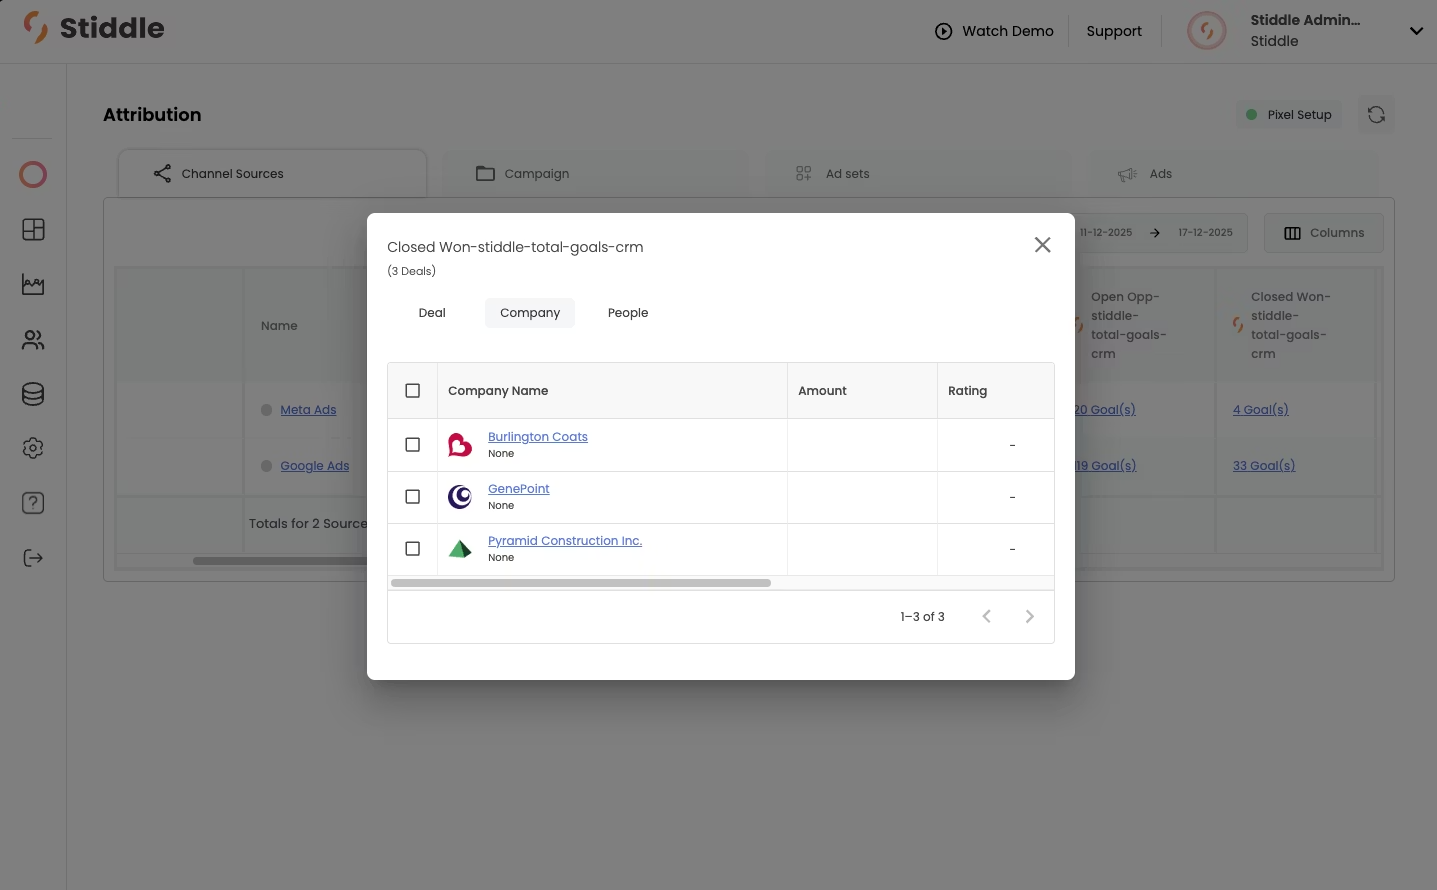
 There are many ways to access company data within Stiddle—through attribution tables, profiles, and analytics. You can also view company attribution at the channel level. Let’s take a look at the attribution table to understand which channels are generating the most deals, broken down by company.
Below, we can see that there are three companies marked as “Closed Won” that have been attributed to Meta Ads. For a deeper breakdown of each company, you can select one to view its details.
There are many ways to access company data within Stiddle—through attribution tables, profiles, and analytics. You can also view company attribution at the channel level. Let’s take a look at the attribution table to understand which channels are generating the most deals, broken down by company.
Below, we can see that there are three companies marked as “Closed Won” that have been attributed to Meta Ads. For a deeper breakdown of each company, you can select one to view its details.

Audiences
Audiences are very easy to build and deploy in Stiddle. There are two common types of audiences: Smart Audiences and Static Audiences.
Smart Audiences are built based on your customer data and can be generated with a single click. These are dynamically generated audiences created specifically for your brand.
Static Audiences are built using filters to define what you want included in an audience. They are highly flexible and can be customized for any use case.
 Every audience is given a few key metrics, including gross revenue, AOV, and 30-, 60-, and 90-day LTV cohort analysis. You can also easily view an overview of the audience on the right before it’s deployed.


Reporting
Reports allow you to query through customer data that Stiddle has ingested, including many types of data such as ad channels, marketing channels, custom conversions, CRM pipeline, purchases, forms, calls, emails, and more.
There are two types of reports in Stiddle. First, we’ll take a look at Flows.
Below, you’ll see a Flow. This is a report that shows what’s happening throughout a buying journey. For example, in the example below, we can see what people do after clicking a Pinterest ad campaign and all the touchpoints that lead to a CRM Closed Won conversion goal.
 Filtering allows you to understand the journeys of visitors based on different scenarios. There are many ways to filter, including by location, touchpoint, page, channel, product, purchase, and more.
For example, we’ve already added a filter for Pinterest Ad at the Step level. But if we add a seperate filter by Google Campaign, the report will show us what people do after clicking a Pinterest ad and overlapping with the specific Google Campaign.
Filtering allows you to understand the journeys of visitors based on different scenarios. There are many ways to filter, including by location, touchpoint, page, channel, product, purchase, and more.
For example, we’ve already added a filter for Pinterest Ad at the Step level. But if we add a seperate filter by Google Campaign, the report will show us what people do after clicking a Pinterest ad and overlapping with the specific Google Campaign.
 By hovering over the path, we can see key metrics—for example, the number of conversions, conversion rate, and drop-off rate to the next step in the journey.
 By clicking on any of the steps, Stiddle will show a few options—View Users, Expand by Property, and Expand by Pages. Let’s select View Users.
 By selecting View Users, Stiddle will show all of the profiles that make up that step. You can then easily build an audience from these people or dive deeper into each profile for a more granular analysis.
 The other common type of report in Stiddle is called a Funnel. Funnels allow you to understand conversions and drop-offs between different steps in a customer’s journey. For example, you might want to understand the drop-off from people that click a Google Ad → view home page → submit a form → CRM Open Oppurtunity → CRM Closed Won and break it down by which channels generated the traffic. Let’s do that.
Below, you’ll see an example of this scenario. We’ve selected the steps, but haven’t yet added a breakdown by source. In the funnel below, it’s showing the drop-off and conversion from the steps above.
The other common type of report in Stiddle is called a Funnel. Funnels allow you to understand conversions and drop-offs between different steps in a customer’s journey. For example, you might want to understand the drop-off from people that click a Google Ad → view home page → submit a form → CRM Open Oppurtunity → CRM Closed Won and break it down by which channels generated the traffic. Let’s do that.
Below, you’ll see an example of this scenario. We’ve selected the steps, but haven’t yet added a breakdown by source. In the funnel below, it’s showing the drop-off and conversion from the steps above.
 Let’s take this a step further to understand where the traffic is coming from. By adding a breakdown by source, Stiddle will show the top channels responsible.
 Now we can see the top channels that overlap with the origional Google Ad (in Step 1), brokendown by each step in the journey.
 As we scroll down, we’ll see the full breakdown in a table.

All reports in Stiddle are very flexible and can be configured using different steps, events, filters, and breakdowns. Customizing the colors and style of the report is very easy as well.